Monitoring
Overview
Open Overview first when you need a quick answer to what is healthy, what is blocked, and where to drill next.
When to use Overview
This is the best entry screen for operators throughout the day. It helps you spot queue pressure, proxy issues, and recent execution activity without drilling into each module first.
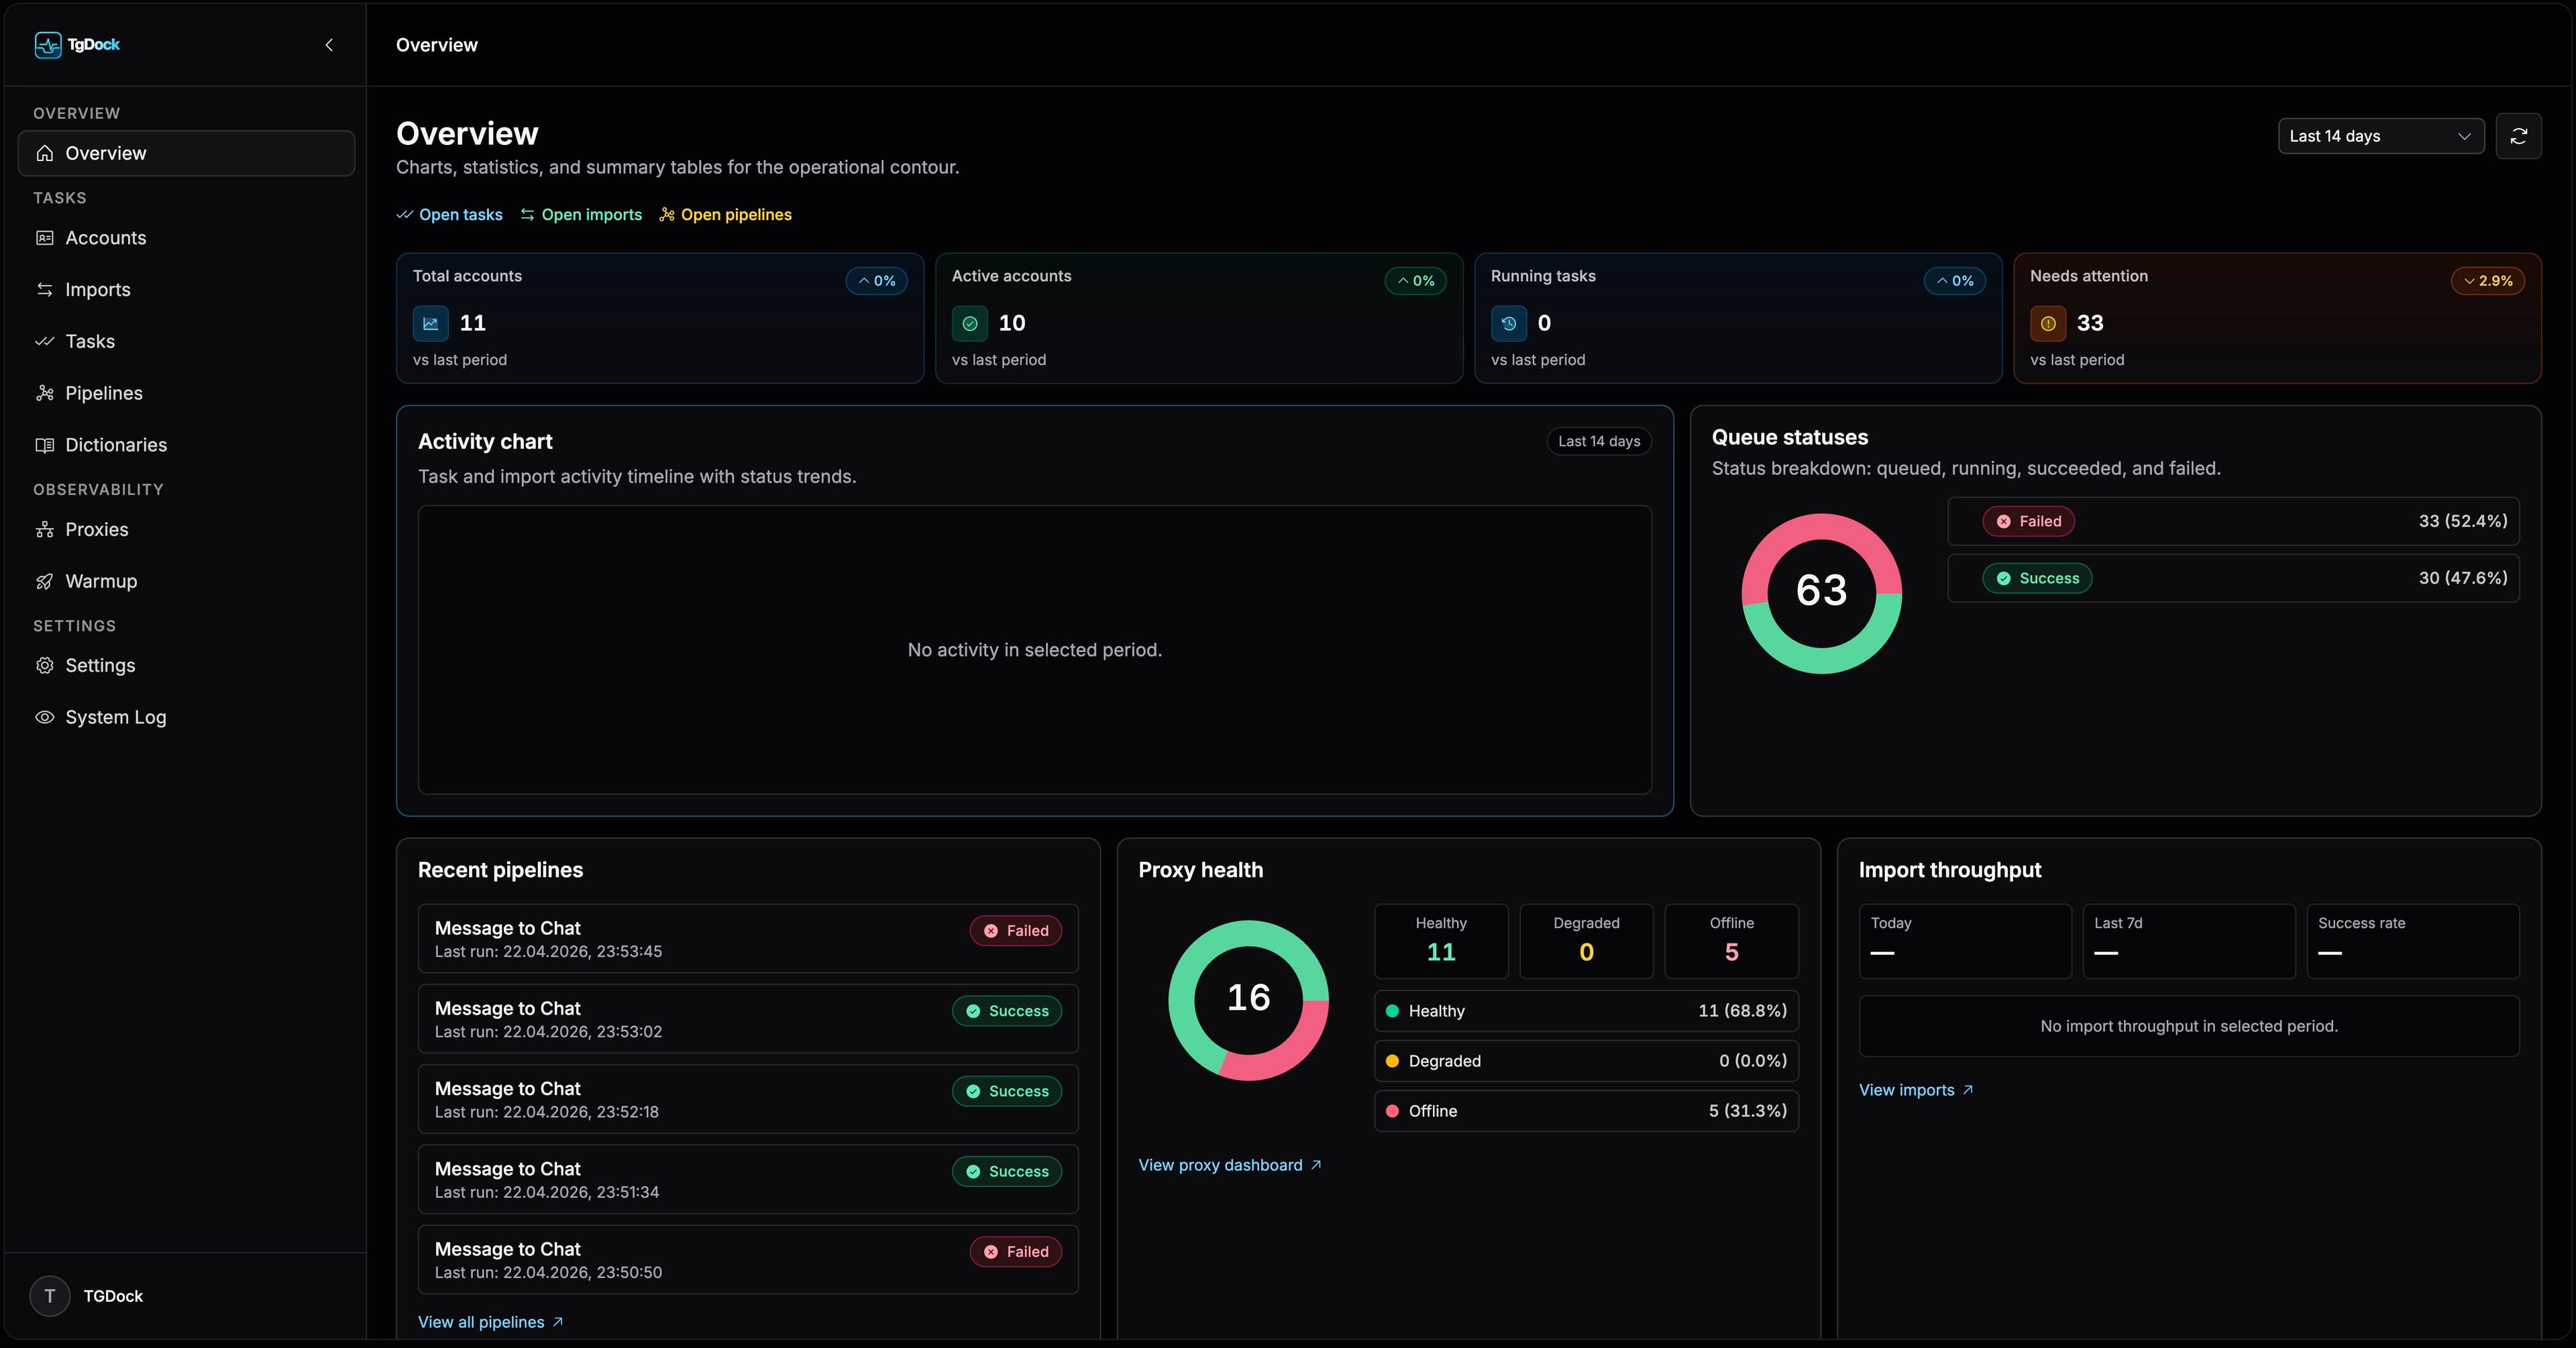
What to check here
- Activity trends for the last 7 or 14 days.
- Queue states and import throughput.
- Recent pipelines and recent tasks.
- Proxy health and quick links into deeper diagnostic screens.
Practical operating flow
Step 01
Choose the right time window
Use 7 days for immediate operational issues and 14 days when you want more context on longer-running trends.
Step 02
Scan recent pipelines first
If a run is paused, stopped, or degraded, jump directly into the pipeline detail screen.
Step 03
Drill into the failing subsystem
Use the quick links to Tasks, Imports, or Pipelines to continue the investigation.